The Super Bowl Indicator suggests stocks rise for the full year when the Super Bowl winner has come from the original National Football League (now the NFC), but when an original American Football League (now the AFC) team has won, stocks fall. We would be the first to admit that this indicator has no connection to the stock market, but “data don’t lie”: The S&P 500 Index has performed better, and posted positive gains with greater frequency, over the past 54 Super Bowl games when NFC teams have won. Of course, it doesn’t always work, as stocks did quite well the past two years even though AFC teams won.
It was originally discovered in 1978 by Leonard Kopett, a sportswriter for the New York Times. Up until that point, the indicator had never been wrong.
A simpler way to look at the Super Bowl Indicator is to look at the average gain for the S&P 500 when the NFC has won versus the AFC—and ignore the history of the franchises. As shown in the LPL Chart of the Day, this similar set of criteria has produced an average price return of 10.2% when an NFC team has won, compared with a return of 7.1% with an AFC winner. An NFC winner has produced a positive year 79% of the time, while the S&P 500 has been up only 65% of the time when the winner came from the AFC.

Here’s the catch. Stocks have actually done just fine lately when the AFC has won. In fact, the S&P 500 Index gained 10 of the past 11 years after an AFC Super Bowl champ.

“There have been 54 Super Bowl winners, yet only 20 teams account for those wins,” said LPL Financial Chief Market Strategist Ryan Detrick. “And wouldn’t you know it, the best stock market performance happens after the Bucs win the big game? But I don’t care, I’m still not rooting for Tom Brady.”
Here’s a breakdown of the 20 Super Bowl winners and how the S&P 500 has done following their victories. For some reason, the author’s favorite team, The Cincinnati Bengals, isn’t on this list. We double checked the data, but they still aren’t on there.

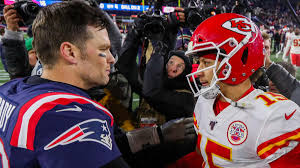
Lastly, this is Tom Brady’s record 10th Super Bowl. It turns out; stocks don’t do well when he is in the game, up only 0.5% for the year. Meanwhile, should he lose (again, what the author is hoping for here), stocks actually do quite poorly, down 10.4% on average.

LPL Research would like to reiterate that in no way shape or form do we recommend investing based on this data, but here’s to a great game and safe Super Bowl weekend everyone!
IMPORTANT DISCLOSURES
This material is for general information only and is not intended to provide specific advice or recommendations for any individual. There is no assurance that the views or strategies discussed are suitable for all investors or will yield positive outcomes. Investing involves risks including possible loss of principal. Any economic forecasts set forth may not develop as predicted and are subject to change.
References to markets, asset classes, and sectors are generally regarding the corresponding market index. Indexes are unmanaged statistical composites and cannot be invested into directly. Index performance is not indicative of the performance of any investment and do not reflect fees, expenses, or sales charges. All performance referenced is historical and is no guarantee of future results.
Any company names noted herein are for educational purposes only and not an indication of trading intent or a solicitation of their products or services. LPL Financial doesn’t provide research on individual equities. All information is believed to be from reliable sources; however, LPL Financial makes no representation as to its completeness or accuracy.
All index and market data from FactSet and MarketWatch.
Securities and advisory services offered through LPL Financial (LPL), a registered investment advisor and broker-dealer (member FINRA/SIPC).